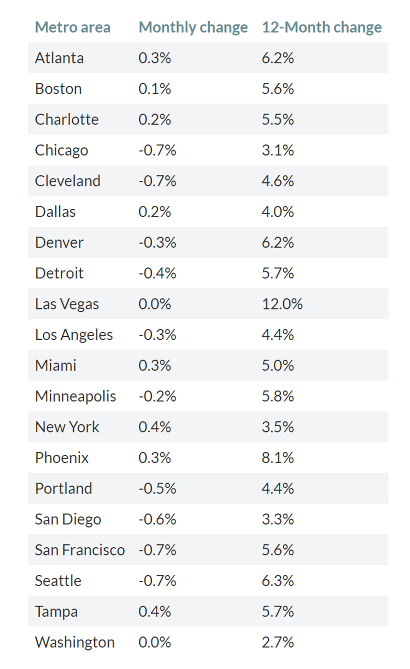
The Case-Shiller Home Price Index was released, which gives us an important, yet slightly dated, read on appreciation. Case Shiller has a few indexes, two of which we pay most attention to – the National Index and the 20-city Index. The National Index, which covers all nine U.S. Census divisions, reported a 0.4% monthly gain and 5.2% annual gain in November. The year over year reading was slightly lower than the 5.3% seen in October. The 20-city Index showed that home prices rose 0.3% month over month and moderated from 5% to 4.7% on a year over year basis. After the release, the media did their best effort to shine a negative light. Here are three of the headlines – Home price growth skids to a 4-year low; Home prices rise at a slower pace; Home price gains slip in November. The problem here is that the media is missing the big picture. 5.2% appreciation is nothing to balk at and is extremely meaningful for wealth creation…oh and by the way beat market expectations. As we have been saying for some time, we see slowing appreciation gains on a year over year basis, but there is a big difference between slowing appreciation gains and prices declining. We think the Spring housing market will surprise a lot of people. The chart below shows 20 of the US Metros and their performance month over month and year over year. The metro areas with the biggest year over year gains were Las Vegas, Phoenix, and Seattle. Some of the biggest monthly losers were cities where prices had surged, including Denver, San Francisco, and Seattle.
#conventionalloans #fhaloans #valoans #firsttimehomebuyer #rentvsown #jumboloans #AZLoans #AKLoans #CALoans #COLoans #WALoans #CaseShillerHPI #HPI #HomePriceIndex